Email performance analytics
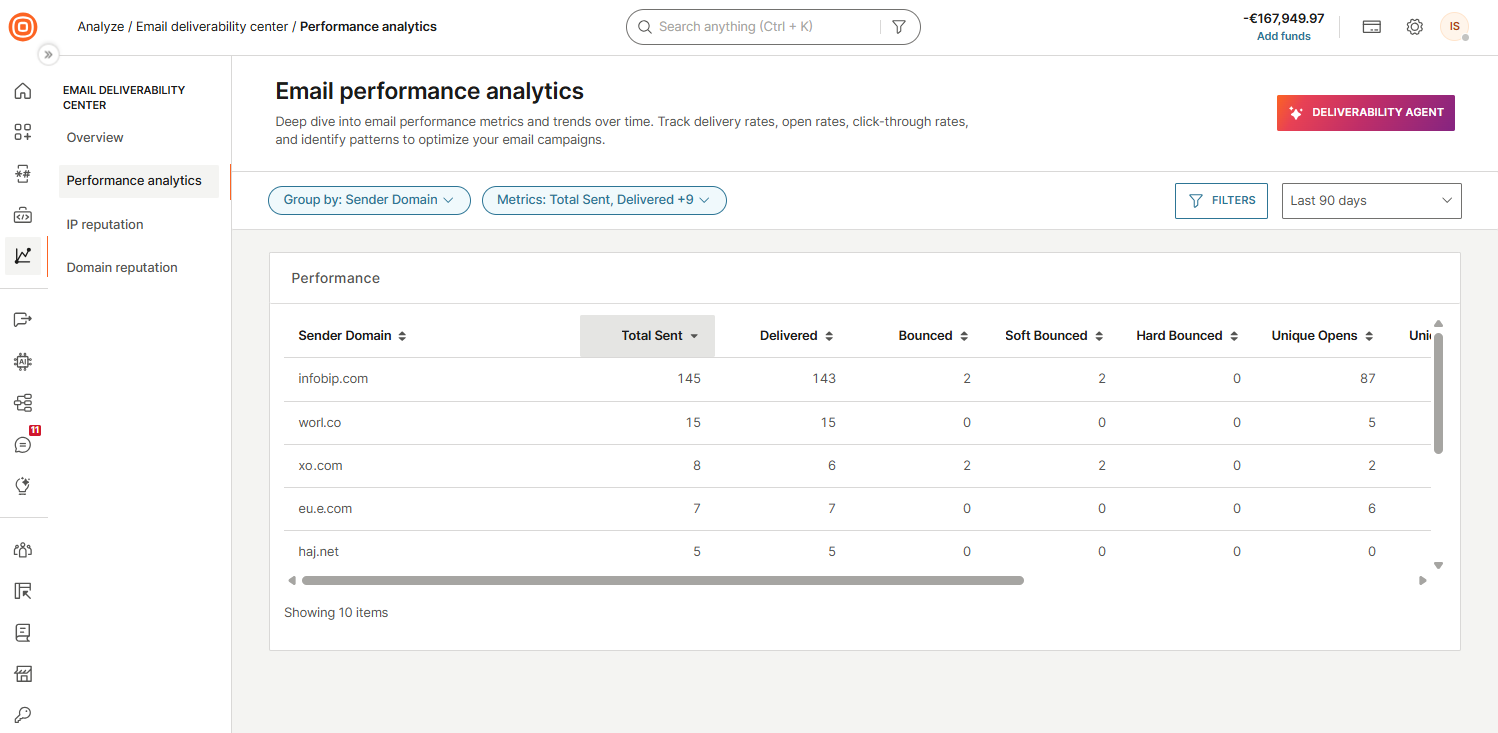
Performance analytics is a free-form data exploration view that lets you slice your email sending data across any combination of dimensions and time periods. Use it to spot trends, compare performance across segments, and drill into the specific senders, domains, IPs, or campaigns that need attention.
Go to Analyze > Email deliverability center > Performance analytics.
Use the Group by and Metrics controls and the Filters and time period controls to customize the data shown.
Group by
Use Group by to define how the Performance table organizes your data. You can group by up to 3 dimensions and time period granularities combined.
Select Apply group by to apply your selection.
The following dimensions are available:
- Sender
- Sender domain
- Recipient domain
- Sending IP
- Envelope domain
- Email provider
- Status group
- Status
- Error code
- Seed list name
- Application
- Entity
- Campaign
The following time period granularities are available:
- Hour
- Day
- Week (Sat start)
- Week (Sun start)
- Week (Mon start)
- Month
- Quarter
- Year
Metrics
Use Metrics to choose which columns appear in the Performance table. The metrics shown below are selected by default. You can add or remove metrics as needed. Select Apply metrics to apply your selection.
The following metrics are available:
- Total sent
- Total accepted
- Delivered
- Delivery rate
- Bounced
- Bounce rate
- Soft bounced
- Soft bounce rate
- Hard bounced
- Hard bounce rate
- Dropped
- Dropped rate
- Suppressed
- Unique opens
- Unique open rate
- Total opens
- Open rate
- Machine opens
- Machine open rate
- Unique clicks
- Unique click through rate
- Total clicks
- Click rate
- Click to open rate
- Unsubscribes
- Unsubscribe rate
- Spam complaints
- Spam rate
- Retried
- Pending
Filters
Use Filters to narrow the data shown in the Performance table. Select Add new filter to narrow the data by one or more of the following dimensions, then select Apply filters.
The following filters are available:
- Sender
- Sender domain
- Recipient domain
- Sending IP
- Envelope domain
- Email provider
- Status group
- Status
- Error code
- Seed list name
- Application ID
- Entity ID
- Campaign
Time period
Select the time period control to set the date and time range for the data. You can choose a predefined period or set a custom range with a specific start day, start time, end day, and end time.
The following predefined periods are available:
- Last 6 hours
- Last 24 hours
- Last 7 days
- This week
- Last week
- This month
- Last month
- Last 30 days
- Last 90 days
Performance table
The Performance table shows your email data grouped by the dimensions you selected in Group by. The first column shows the dimension value and the remaining columns show the selected metrics.
Select any column header to sort by that metric. When many metrics are selected, move horizontally across the table to see all columns.
IP reputation
Sending IP health across Google Postmaster Tools, Microsoft, Sender Score, and blocklists.
Domain reputation
Authentication rates, blocklist status, and spam trap hits for your sender domains.
Email monitoring and performance
Broader email analytics view outside the Email deliverability center.